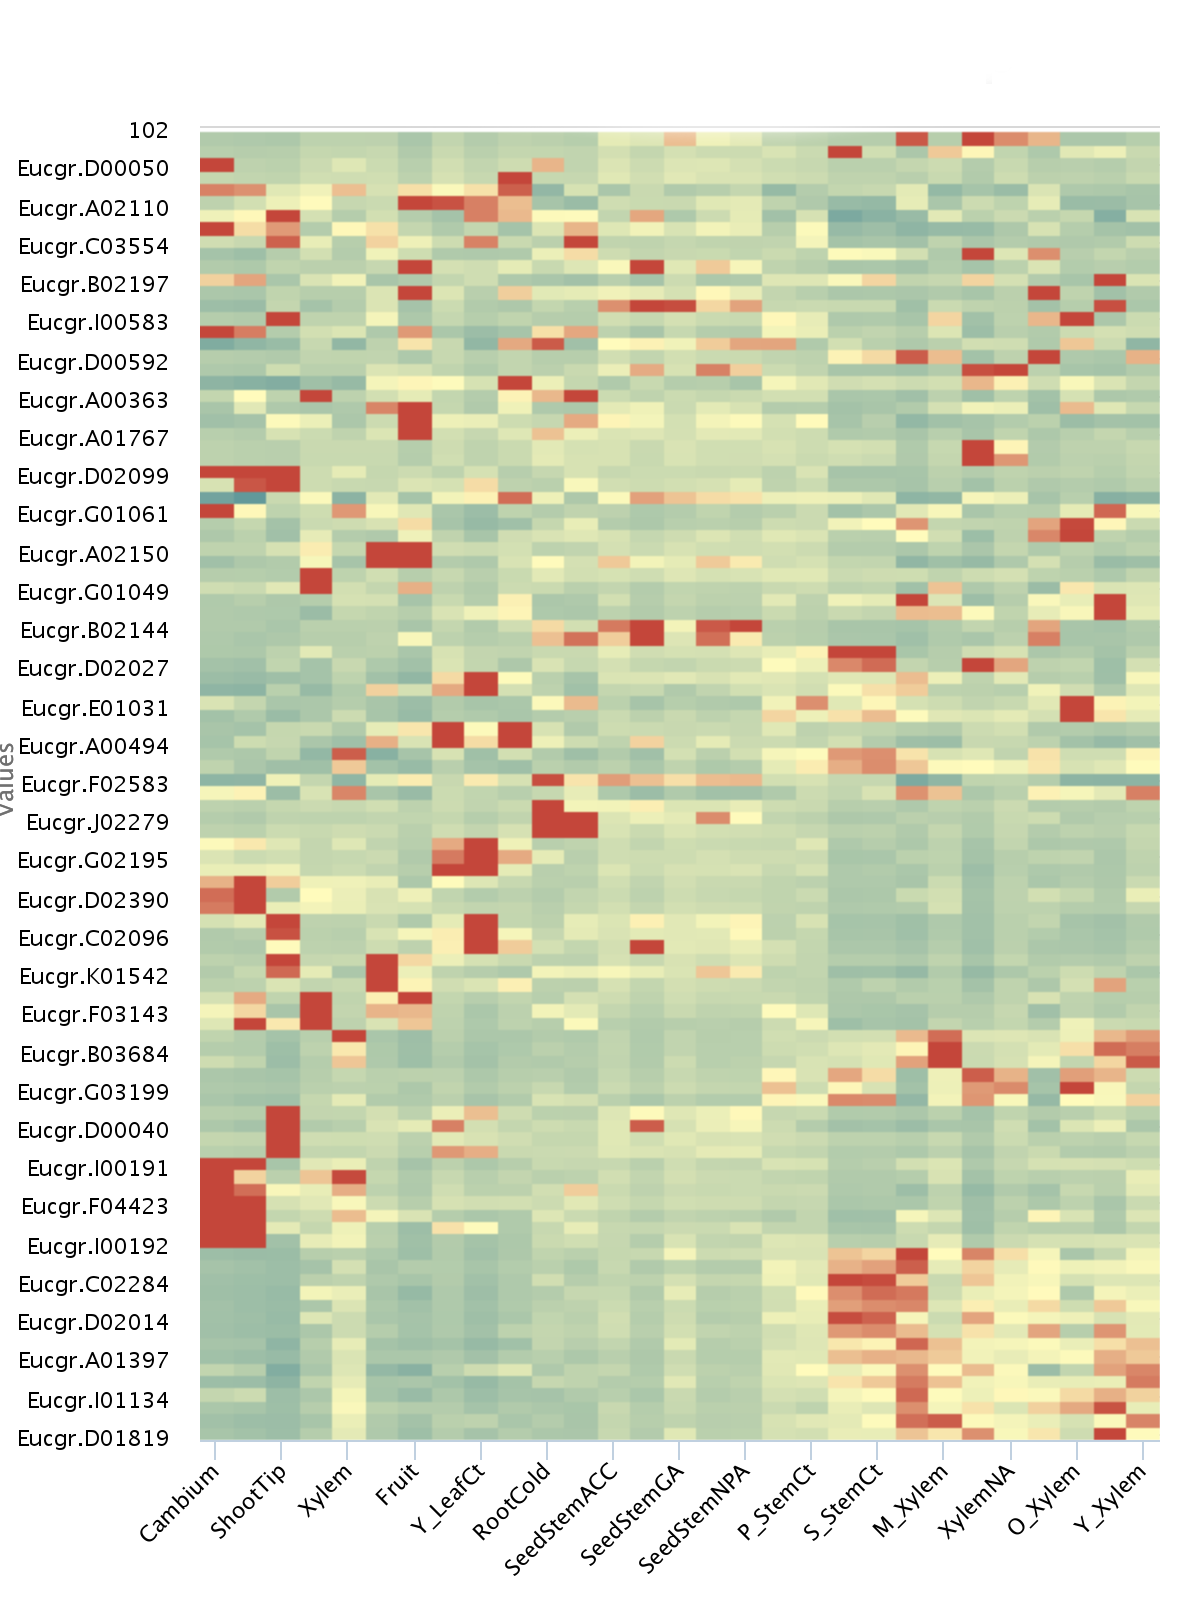
Heatmaps
 click to enlarge
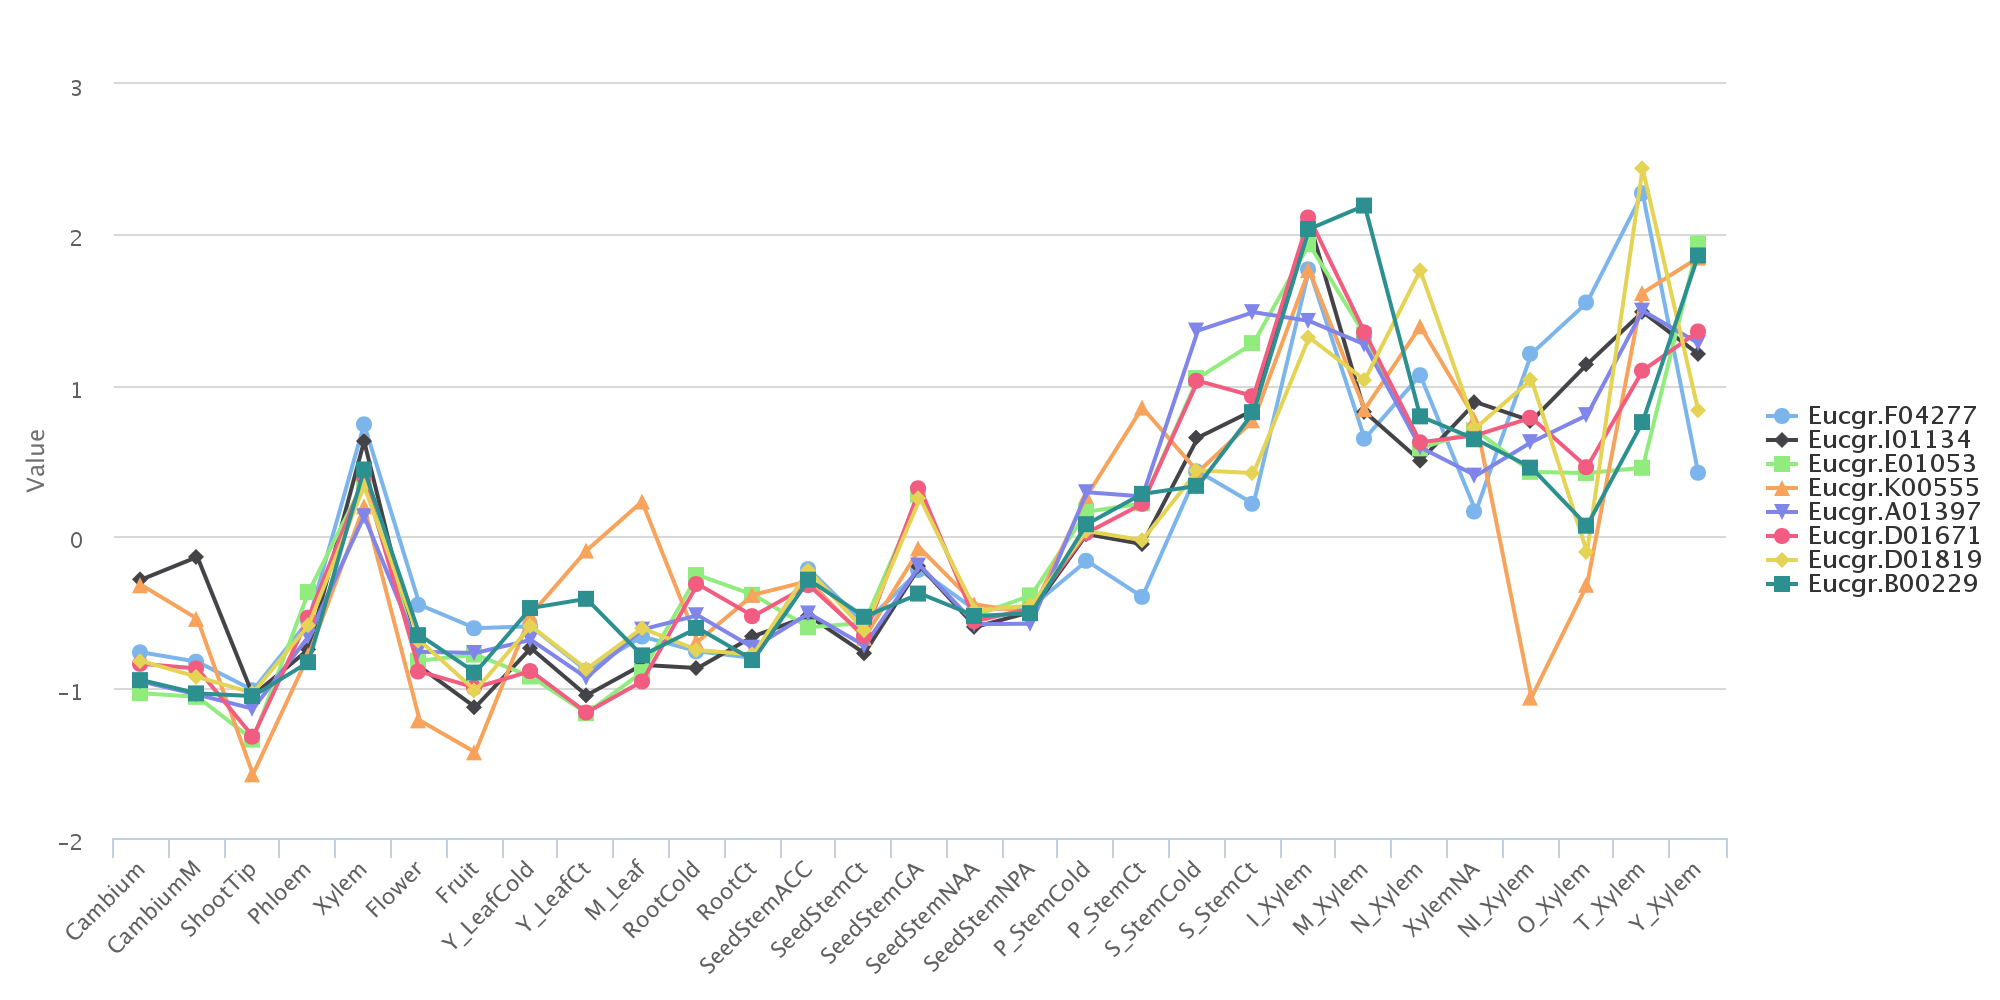
Profiles
 click to enlarge
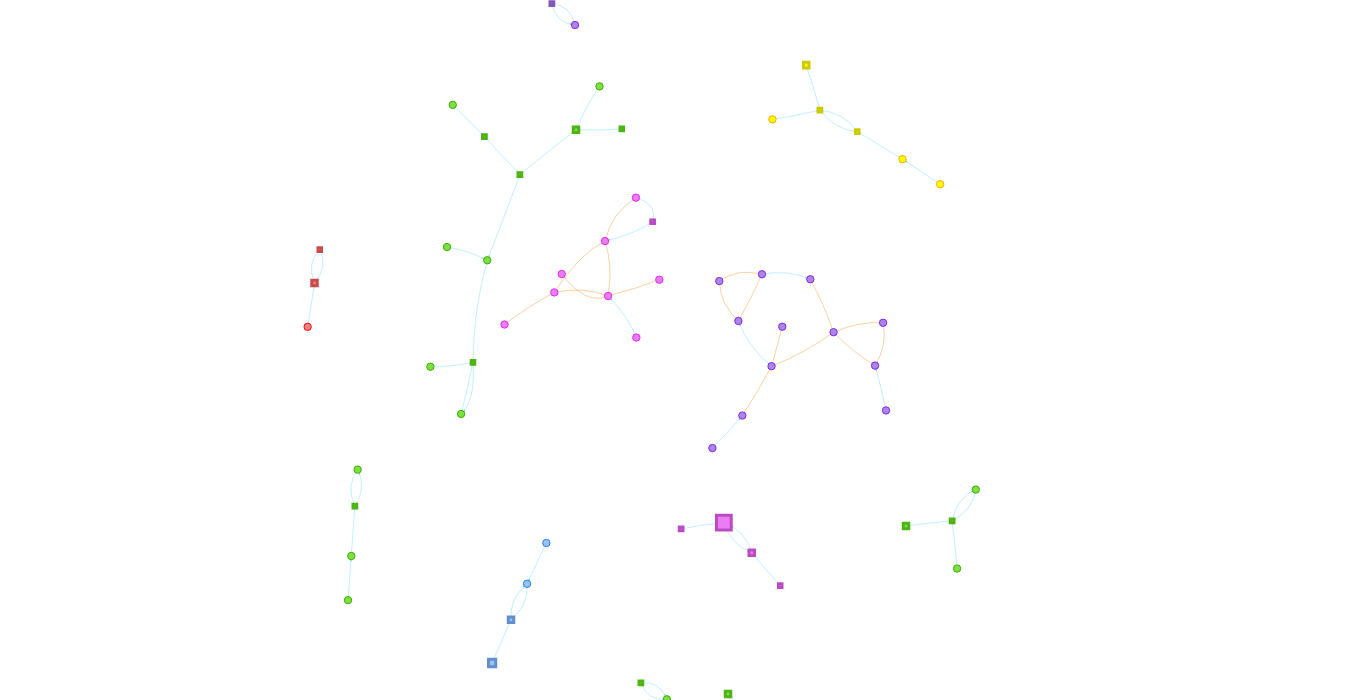
Networks
 click to enlarge
Those are only images, the visualisation tools provides more dynamics graphs
The Express Db website is an online Tool that will allow you to easily compute clustering on your expression data and provides usefull visualisation tools as heatmaps, graphs and networks
You will also be able to load your own annotations file and do researches in the clustering results
see more
click to enlarge
click to enlarge
click to enlarge
Those are only images, the visualisation tools provides more dynamics graphs
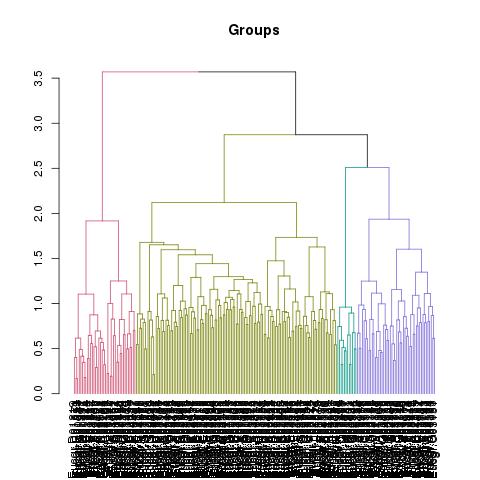
To order the gene by expression values, we compute hierarchical clustering and genes are classified into groups
The clustering results are used to display graphs and networks.
The database contains annotaions
so it is possible to look for specific genes in your dataset.
Want to test ? Login with Demo account !
![]()